 |
 |
 |
 | | |

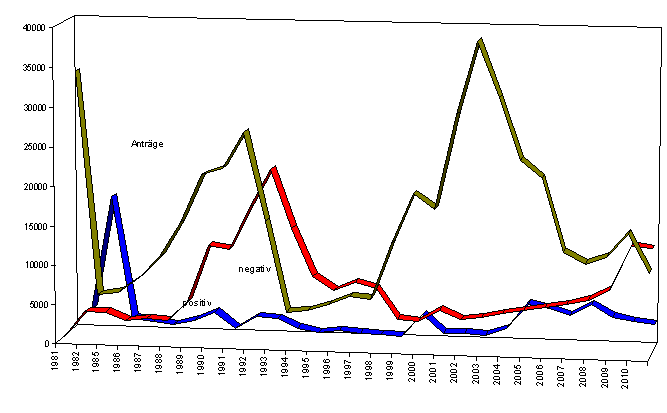
| Überblick Erledigungen der Asylbehörden 1981 - 2010 [Anny Knapp, asylkoordination aktuell] |
 Übersicht
Statistiken Übersicht
Statistiken |


Jahr |

Asylanträge |

abgeschlossene Verfahren |

positiv |

negativ * |

Asylquote |
 |
1981
|
34.557 |
6.087 |
2.801 |
3.286 |
46,0% |
1982
|
6.314 |
20.543 |
17.361 |
3.282 |
84,5% |
1985
|
6.724 |
4.155 |
1.876 |
2.279 |
45,2% |
1986
|
8.639 |
3.991 |
1.430 |
2.561 |
35,8% |
1987
|
11.406 |
3,550 |
1.115 |
2.435 |
31,4% |
1988
|
15.790 |
6.718 |
1.785 |
4.933 |
26,6% |
| 1989 |
21.882 |
15.013 |
2.879 |
12.134 |
19,2% |
1990
|
22.789 |
12.648 |
864 |
11.784 |
6,8% |
1991
|
27.306 |
19.686 |
2.469 |
17.217 |
12,5% |
1992
|
16.238 |
24.361 |
2.289 |
22.072 |
9,4% |
1993
|
4.744 |
15.885 |
1.193 |
14.692 |
7,5% |
1994
|
5.082 |
9.295 |
684 |
8.611 |
7,4% |
1995
|
5.920 |
7.955 |
993 |
6.962 |
12,5% |
1996
|
6.991 |
9.090 |
716 |
8.032 |
7,9% |
1997
|
6.719 |
8.363 |
639 |
7.286 |
7,6% |
1998
|
13.805 |
9.499 |
500 |
3.491 |
12,5% |
| 1999 |
20.129 |
17.643 |
3.393 |
3.300 |
50,7% |
2000
|
18.284 |
20.514 |
1.002 |
4.787 |
17,3% |
2001
|
30.135 |
25.804 |
1.114 |
3.642 |
23,4% |
2002
|
39.354 |
29.833 |
1.018 |
4.034 |
20,1% |
2003
|
32.364 |
28.395 |
1.829 |
4.604 |
28,4% |
2004
|
24.634 |
25.423 |
5.136 |
5.086 |
50,3% |
2005
|
22.471 |
17.525 |
4.552 |
5.542 |
45,5% |
2006
|
13.350 |
15.279 |
3.782 |
5.893 |
40,0% |
2007
|
11.879 |
16.047 |
5.197 |
6.646 |
44,0% |
2008
|
12.841 |
15.326 |
3.753 |
7.968 |
32,0% |
2009
|
15.821 |
20.237 |
3.247 |
13.531 |
19,4% |
2010
|
11.012 |
18.779 |
2.977 |
13.290 |
18,3% |
|
* enthält bis 1997 auch Verfahrenseinstellungen und zurückgezogene Anträge

Quelle: BMI, eigene Berechnungen
[Anny Knapp - asylkoordination aktuell]

|
|
|
